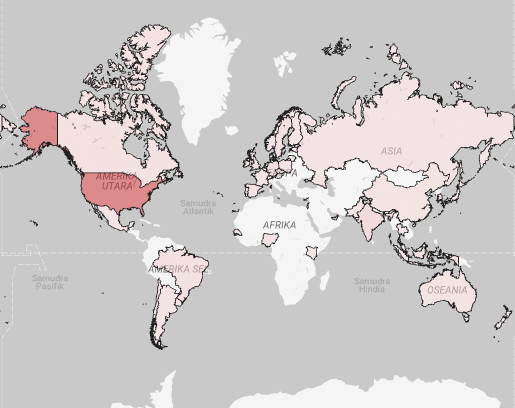
The Data Proves It: Trillion-Dollar Funding Doesn't Guarantee Job Security 📉
We often assume that joining a tech company fresh off a massive fundraising round is the safest career move. However, after diving into the Global Tech Layoff data (2020-2024)—covering 558,000+ impacted talents—the data tells a different story.
In my latest portfolio analysis, I processed raw datasets using Python for cleaning and Looker Studio for visualization. The findings reveal a "Funding Paradox":
A business ecosystem with a total recorded investment of $1.2 Trillion is not immune to the layoff storm. This provides a crucial insight: in a high-interest-rate era, company health metrics have shifted from "Valuation" & "Total Funding" to "Sustainability" & "Cash Flow."
Other key takeaways from this dashboard:
The January Purge: Historically, Q1 (specifically January) is the most vulnerable month for layoffs due to annual budget restructuring cycles.
Volume vs. Severity: The Retail/Consumer sector accounts for the highest number of impacted individuals (labor-intensive), but the Hardware/EV sector shows the highest severity (often slashing >50% of the team or shutting down entirely).
Data is more than just numbers; it’s a navigation map for making smarter career and investment decisions.
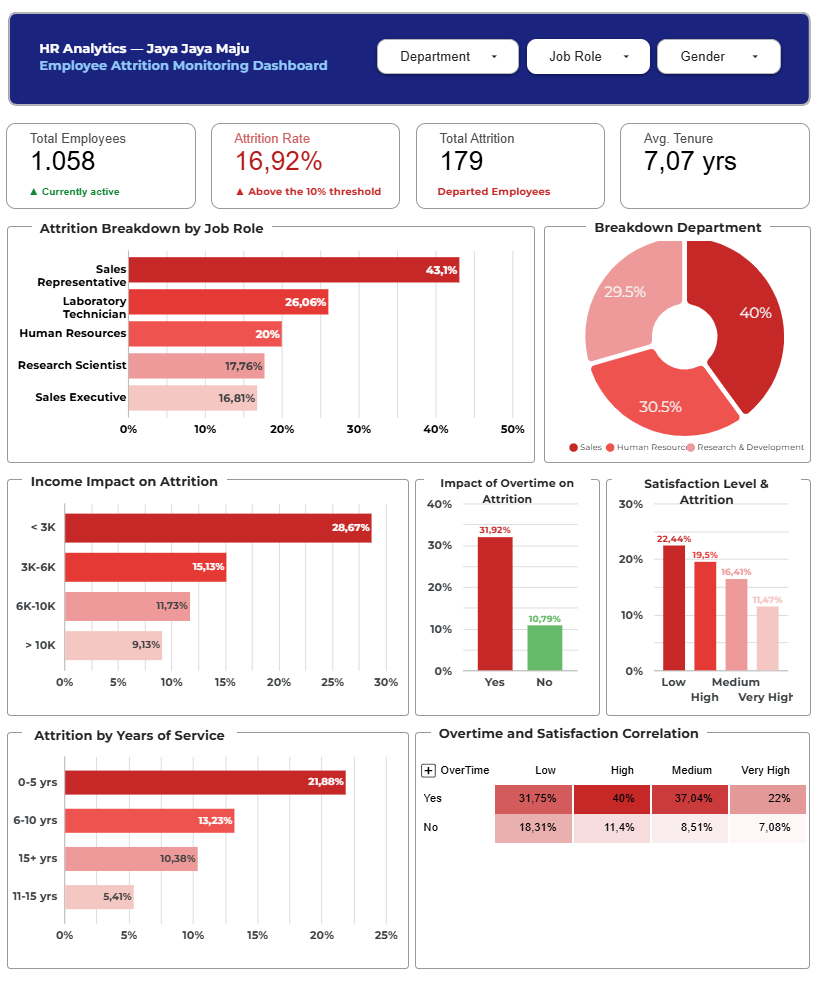
Jaya Jaya Maju is a multinational corporation established in 2000, with a workforce of over 1,000 employees spread across the country. Despite its significant scale, the company still faces challenges in managing its workforce. This has resulted in a high attrition rate—the ratio of staff departures relative to the total headcount—exceeding 10%.
The HR Department requires assistance in identifying the various factors driving this high turnover rate and seeks a business dashboard to monitor these factors on a continuous basis.
This end-to-end data analytics project focuses on diagnosing and understanding customer churn within the banking sector. With a churn rate of 20% across 10,000 customers, the bank faced a critical challenge: retaining financially stable, long-term clients who were actively moving their capital to competitors.
The analysis was conducted using the CRISP-DM (Cross-Industry Standard Process for Data Mining) methodology — moving beyond surface-level visualization into deep business understanding and strategic evaluation.
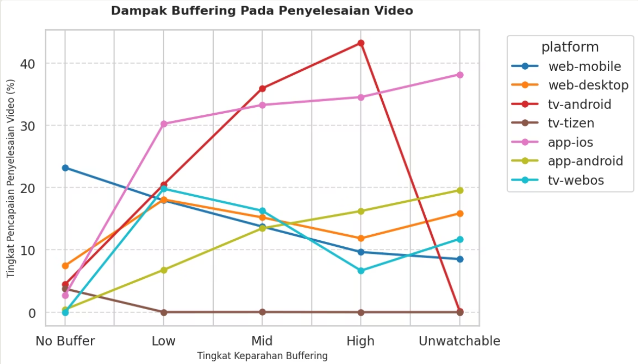
This project explores a massive-scale user interaction dataset (approx. 14GB) from a major Video-on-Demand (OTT) platform. The primary objective is to translate raw viewing logs into actionable business strategies across four key pillars: Marketing ROI, Technical User Experience (UX), Product Feature Effectiveness, and Content Monetization.
By processing millions of rows using highly memory-efficient techniques, this analysis provides clear, data-driven recommendations to optimize ad spend, reduce churn rate, and maximize platform loyalty.